Automated Reptile Habitat

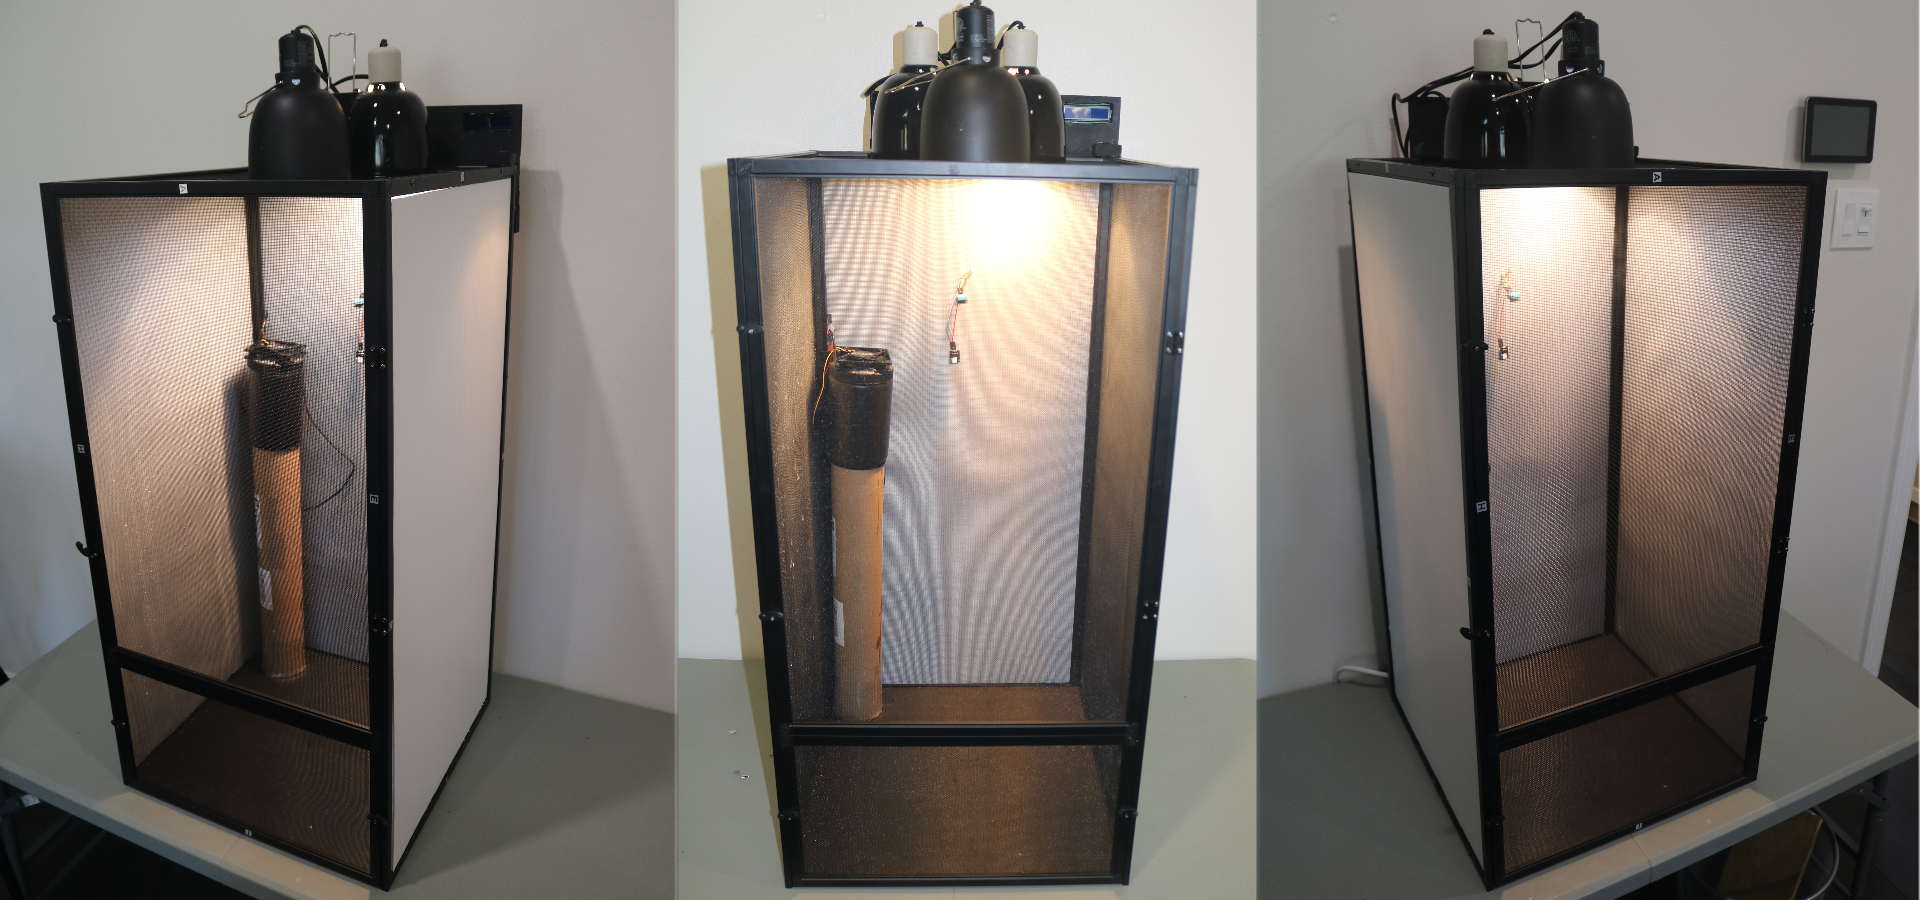
For my senior project my team and I built and programmed an automated reptile habitat. We learned that, due the the strict habitat requirements of reptiles, 75% die within their first year as a pet. Due to this, our goal for this project was to automate the day/night cycle, UVB light, temperature and humidity of the habitat to make it easier to keep them healthy.
Throughout the semester of working on this project we not only had to build and program the habitat but we also had to create all of the following documentation:
- Team Charter
- Vision and Scope
- Requirements Document
- Project Plan
- Design Document
- Test Plan
Day/Night and UVB Cycle, Temperature, and Humidity
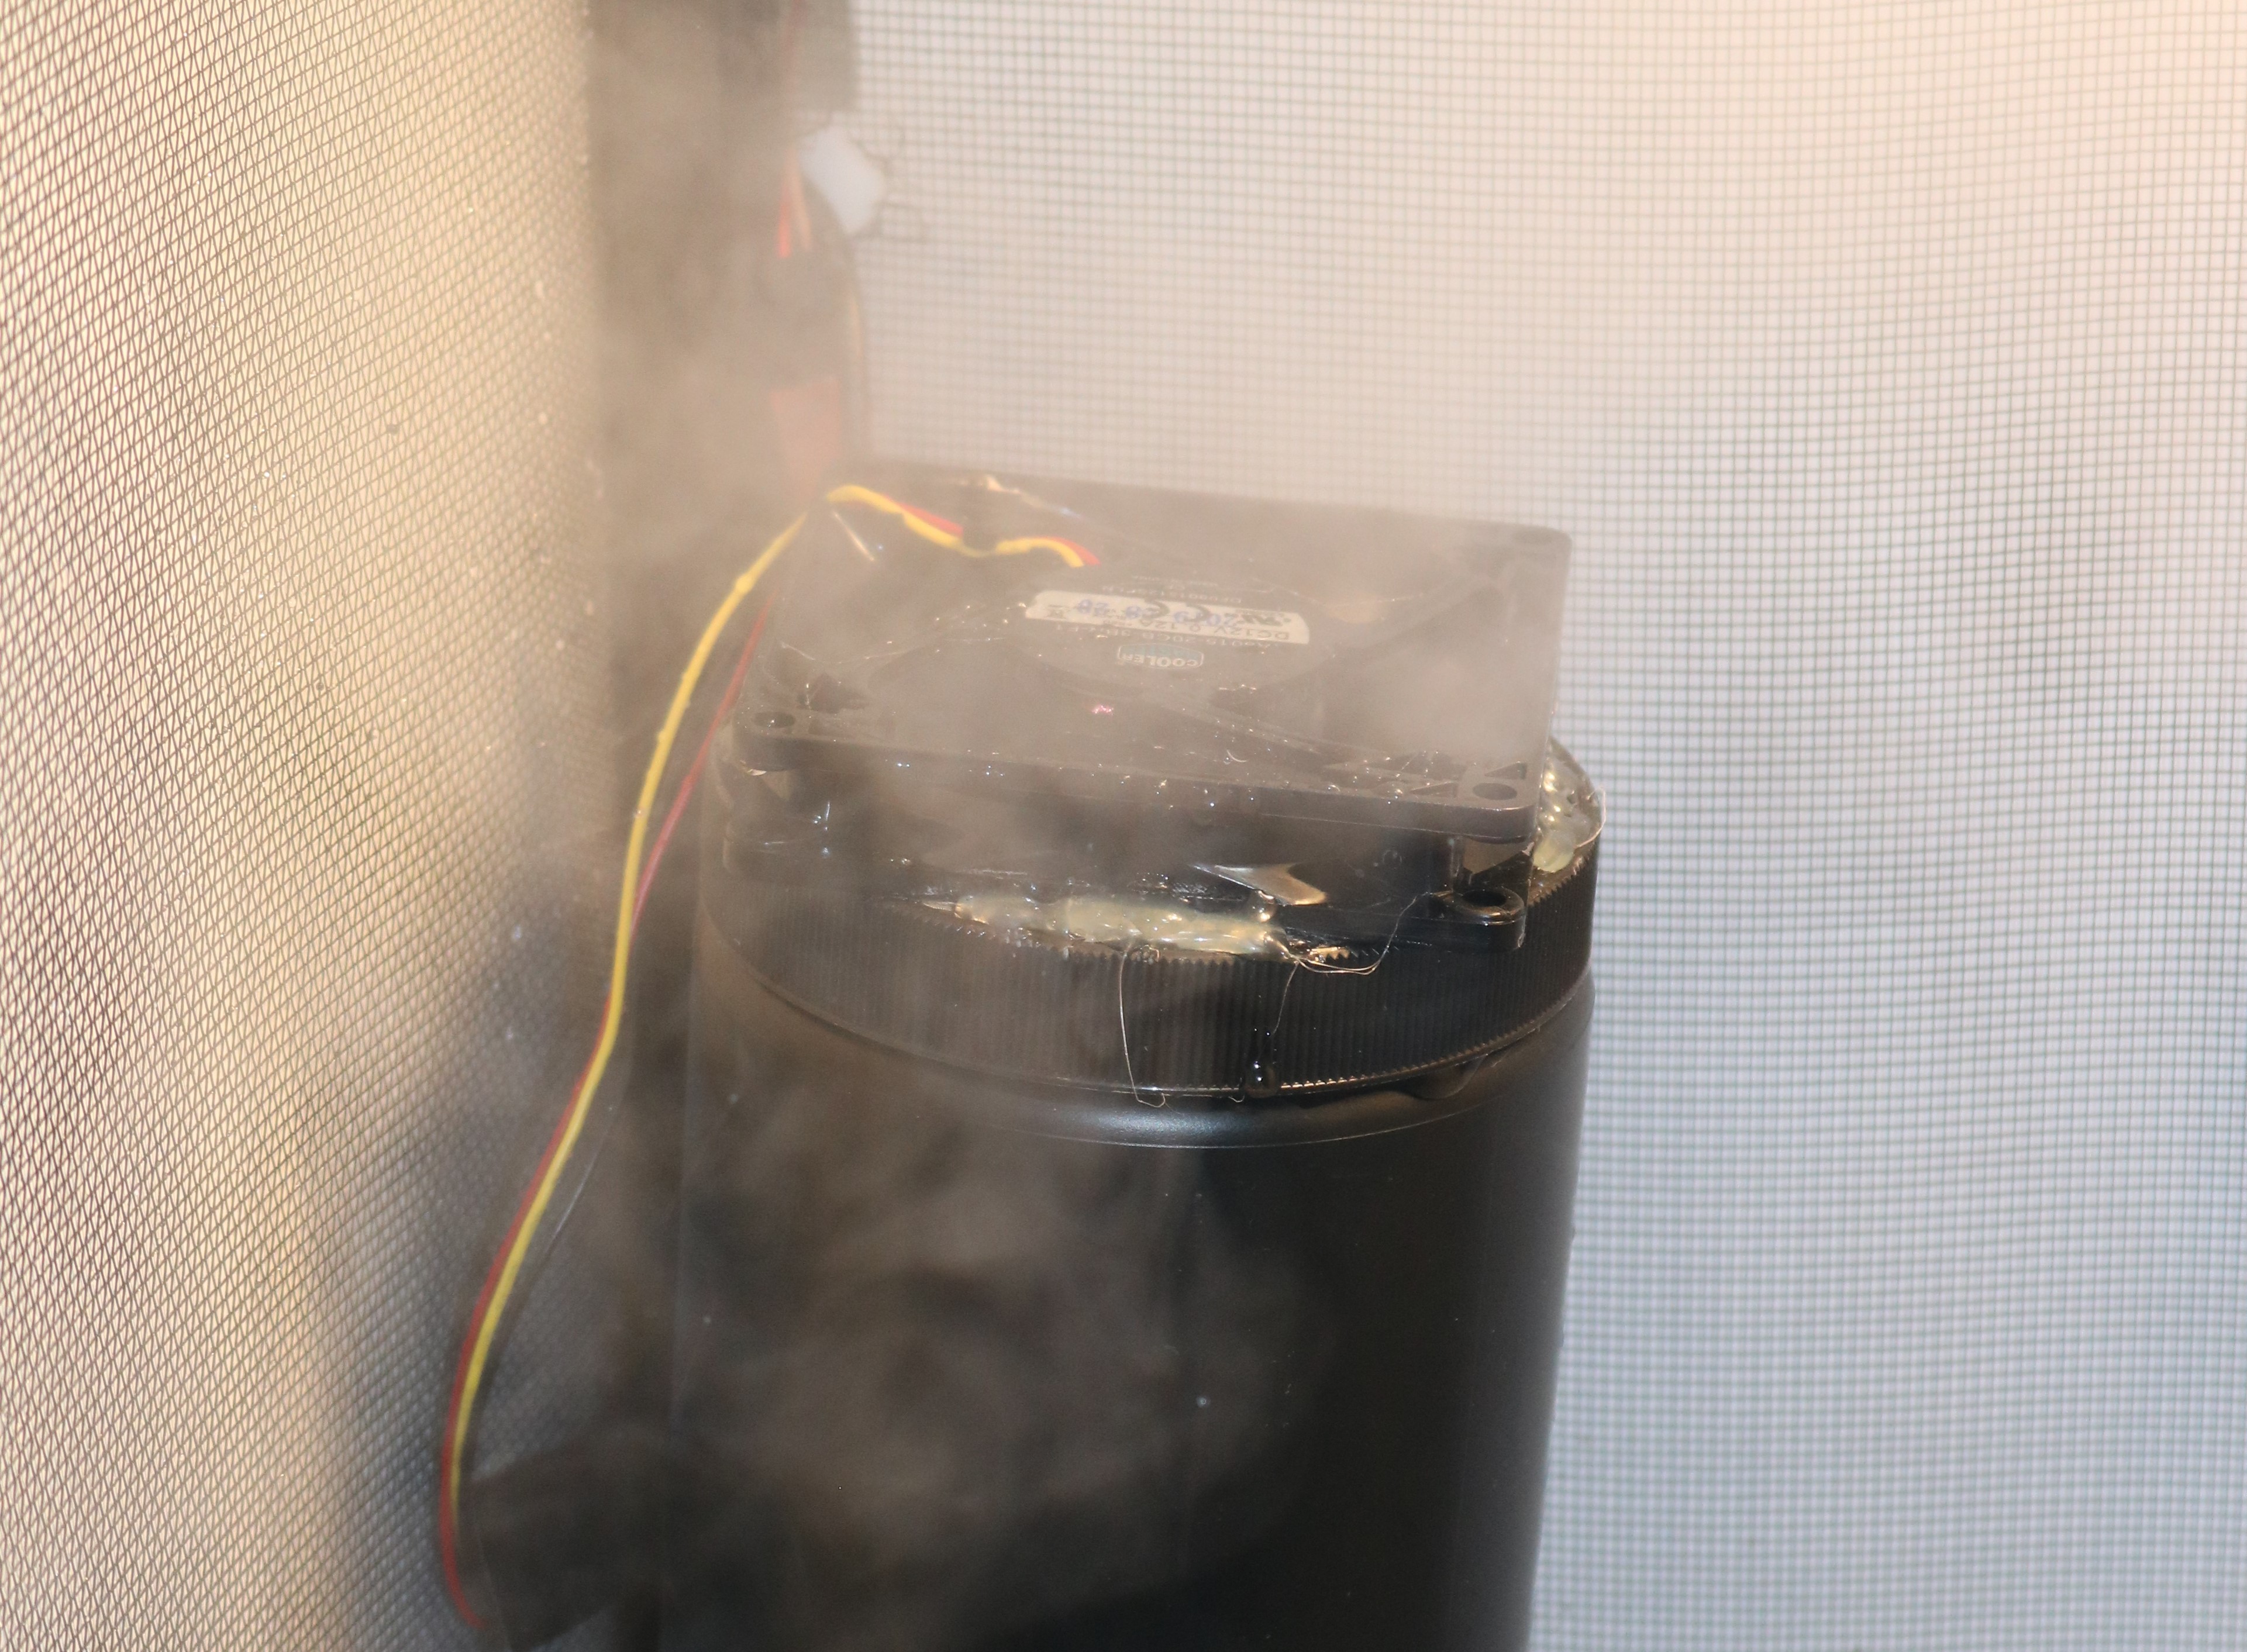
The 12 hour day/night cycle used an incandescent bulb to provide consistent light during the day. The UVB light is also on the same schedule. The UVB light allows the synthesis of vitamin D3, which helps allow the absorbtion of calcium. Inorder to maintain the humidity, we build our own humidifier. We built this using an ultrasonic mister, computer case fan and water reservoir. Below is a picture of our humidifier in action.
System
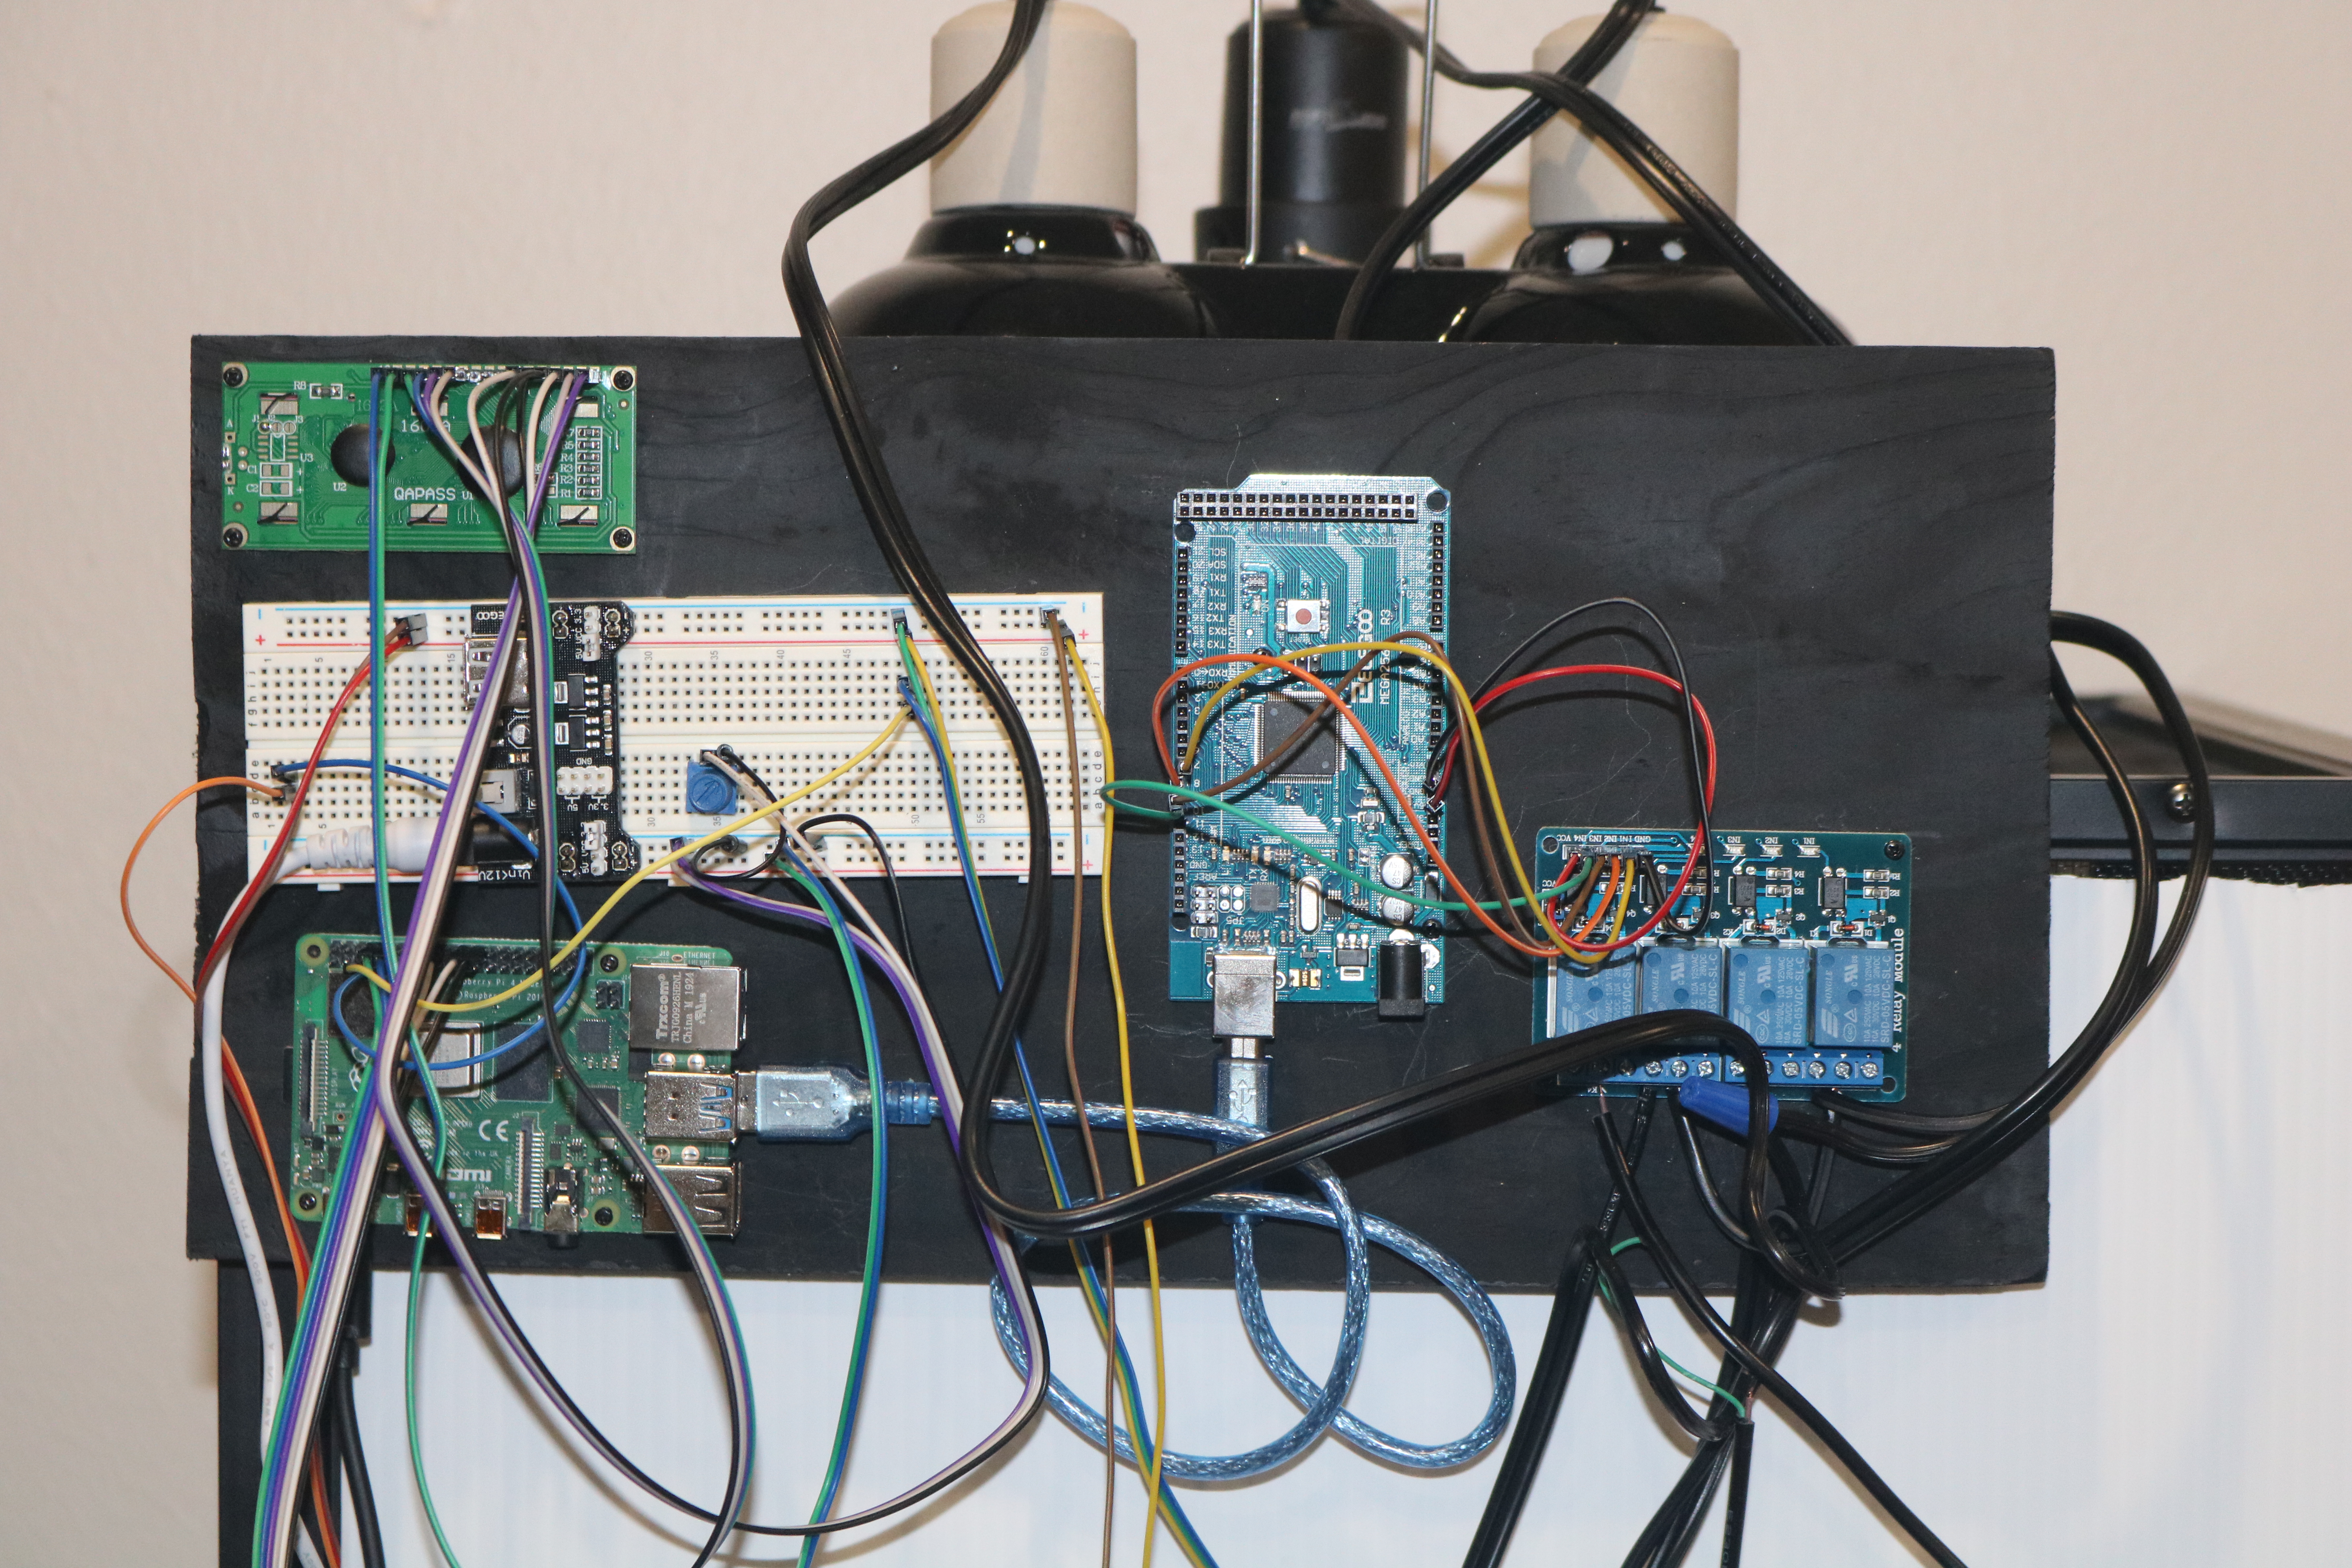
The controller for our system was a Raspberry Pi. This was connected to two DHT-11 sensors to collect the temperature and humidity readings. An Arduino was also connected to the Raspberry Pi via USB. The arduino was connected to the relays which controlled the heat lamp, lights and mister.
The system was controlled by a python program running on the Raspberry Pi. This program checked the temperature and humidity readings once every minute. If any of these readings are out of range, it will then turn the heat-lamp/mister on or off as necessary. The day/night cycle is also controlled by this program using the system time. From 8 AM to 8 PM the lights are on for the daytime cycle and 8 PM to 8 AM for the night cycle.
Monitoring
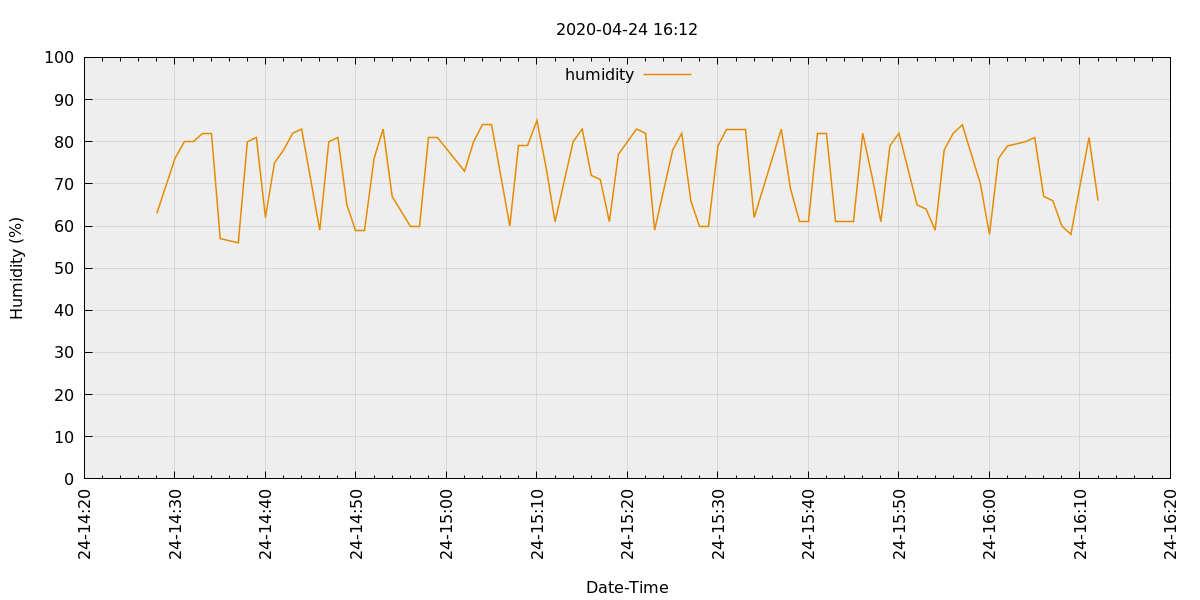
The readings for the temperature and humidity are written to a .csv file along with a timestamp for the readings. There is then a script that will plot the readings on a graph. An example of the humidity graph is shown below.


